
Introduction
Following the implementation of the Affordable Care Act (ACA) Medicaid expansion to low-income adults in 2014, there were large increases in Medicaid and CHIP enrollment across states that build on steady progress covering children over the past decade. These increases reflected enrollment among newly eligible adults in states that implemented the expansion as well as enrollment among previously eligible adults and children due to enhanced outreach and enrollment efforts and simplified enrollment procedures associated with the ACA. However, in 2018, enrollment declined by 1.6 million individuals, reversing this trend and raising questions about whether individuals losing Medicaid and CHIP coverage are becoming uninsured or transitioning to other coverage.
This fact sheet provides analysis of this recent enrollment decrease and discusses potential implications for coverage rates. It is based on Kaiser Family Foundation analysis of the Centers for Medicare and Medicaid Services (CMS) Performance Indicator Project Data. The enrollment counts include full-benefit individuals of all ages enrolled in Medicaid and CHIP for each month, including those with retroactive, conditional, and presumptive eligibility.
Findings
Between December 2017 and December 2018, total Medicaid and CHIP enrollment fell by 1.6 million people or -2.2%, from 74.6 to 73.0 million enrollees (Figure 1 and Table 1). Both adults and children experienced enrollment declines in the 48 states able to report separate data for children.
- Enrollment for children fell by nearly 730,000 or -2.0%, from 36.0 million in December 2017 to 35.3 million in December 2018.
- Enrollment for adults fell by nearly 737,000 or -2.1%, from 35.1 million in December 2017 to 34.3 million in December 2018.
- Enrollment declined by about 173,000 overall in the remaining three states that did not report separate data for children (Arizona, the District of Columbia, and Tennessee).
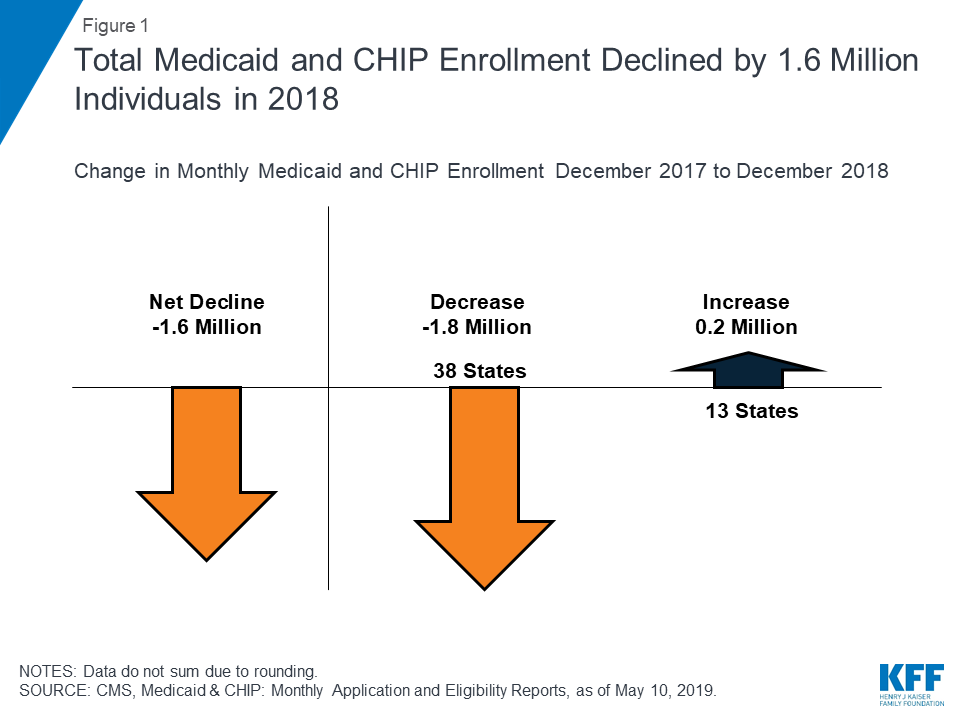
Figure 1: Total Medicaid and CHIP Enrollment Declined by 1.6 Million Individuals in 2018
A total of 38 states, including the District of Columbia, had enrollment decreases in 2018. Six states had enrollment decreases that exceeded -5%, including Tennessee (-9.8%), Missouri (-7.2%), Arkansas (-6.9%), Ohio (-6.8%), Illinois (-6.6%), and Idaho (-5.8%) (Map 1 and Figure 2). Information on what is contributing to these decreases is limited. However, Tennessee, Arkansas, and Missouri have implemented new eligibility systems and/or redetermination processes that media and other reports suggest are contributing to enrollment losses, and, in 2018, Arkansas disenrolled over 18,000 individuals due to failure to meet new work and reporting requirements., In the remaining 13 states, enrollment remained flat or increased, with the largest percent increases in Alaska (5.8%), Iowa (3.6%), and Virginia (2.4%). The increases in Alaska and Virginia may reflect the later implementation of the ACA Medicaid expansion to adults. The expansion became effective in September 2015 in Alaska and Virginia began accepting applications in late 2018, with coverage becoming effective as of January 2019.
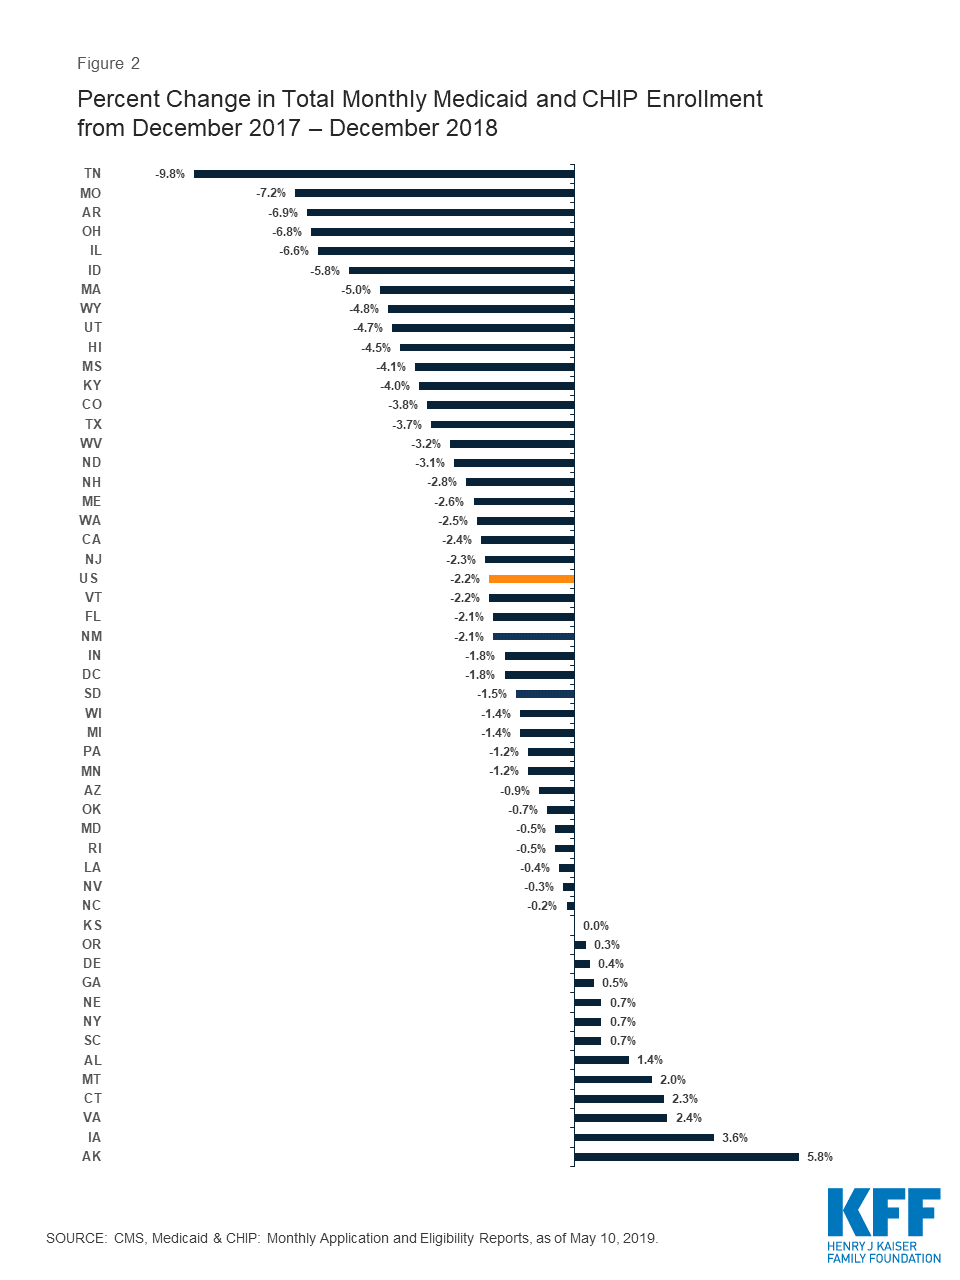
Figure 2: Percent Change in Total Monthly Medicaid and CHIP Enrollment from December 2017 – December 2018
Among the 48 states able to report separate data for children, there were enrollment declines for children in 36 states and 35 states had enrollment decreases for adults. States with the largest percent enrollment decreases for children included Missouri (-9.0%), Utah (-7.3%), and Idaho (-6.5%) (Map 1). The largest percent enrollment decreases for adults were in Arkansas (-11.2%), Ohio (-8.4%), and Illinois (-8.2%). The largest percent increases for children occurred in Alaska (3.4%), Iowa (3.0%), and Virginia (2.8%), and, for adults, the largest percent increases were in Alaska (7.7%), Georgia (5.5%), and Montana (4.3%).
–
| NOTES: N/A: Data to calculate separate enrollment for adults and children are not available for AZ, DC, and TN. SOURCE: CMS, Medicaid & CHIP: Monthly Application and Eligibility Reports, as of May 10, 2019. |
Overall, total enrollment as of December 2018 remains 27.2% higher compared to states’ pre-ACA monthly average enrollment in the 49 states reporting data for both periods. However, December 2018 enrollment fell below pre-ACA monthly average enrollment levels in four states Wyoming (-13.9%), Utah (-1.9%), Oklahoma (-1.9%), and Vermont (-0.6%).
Implications
The enrollment declines observed in 2018 reverse a previous trend of Medicaid and CHIP enrollment increases and raise questions about whether they reflect a growing number of individuals becoming uninsured or transitioning to other coverage. While some of the enrollment decreases may reflect individuals moving to other coverage as a result of increases in income or changes in employment amid the improving economy, gains in employment may not necessarily translate into increases in employer-sponsored insurance (ESI). Lower-income workers are less likely to have an offer of ESI through their job and, even if an offer is available, it may not be affordable. A portion of the declines may also reflect some states catching up on redeterminations after having delayed them for a period of time as they implemented new systems under the ACA. However, survey data point to a slight uptick in uninsured rates among poor and near-poor nonelderly individuals in 2018, and a range of policies may be leading to coverage losses. There are emerging reports that eligible individuals may be losing Medicaid and CHIP coverage due to challenges with enrollment and renewal processes and new eligibility Medicaid eligibility restrictions in some states.,,, Further, policy changes outside of Medicaid could be dampening enrollment and leading to coverage losses, including the Trump administration’s substantial decrease in funding for outreach and enrollment assistance and shifting immigration policies. To understand these changes in enrollment and their impact on coverage will require assessing what factors account for the recent declines and whether people losing Medicaid and CHIP coverage are becoming uninsured and facing increased obstacles to obtaining affordable health care.