
Health insurance coverage is a critical factor in making health care affordable and accessible to women. Among the 97.4 million women ages 19 to 64 residing in the U.S., most had some form of coverage in 2018. However, gaps in private sector and publicly-funded programs and lack of affordability left a little over one in ten women uninsured. The Affordable Care Act (ACA) expanded access to affordable coverage through a combination of Medicaid expansions, private insurance reforms, and premium tax credits. This factsheet reviews major sources of coverage for women residing in the U.S. in 2018, discusses the impact of the ACA on women’s coverage, and the coverage challenges that many women continue to face.
Sources of Health Insurance Coverage
Employer-Sponsored Insurance
Approximately 58.6 million women ages 19-64 (60%) received their health coverage from employer-sponsored insurance in 2018 (Figure 1).
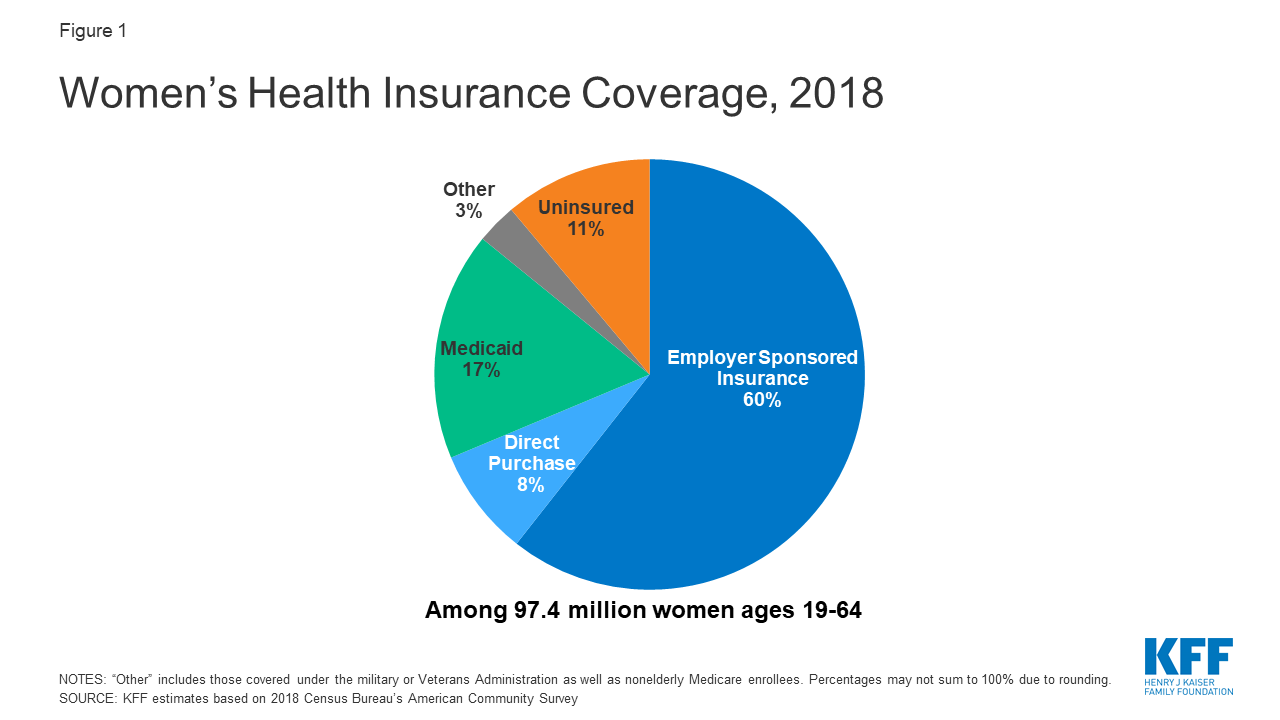
Figure 1: Women’s Health Insurance Coverage, 2018
- Women in families with at least one full-time worker are more likely to have job-based coverage (71%) than women in families with only part time workers (33%) or without any workers (18%).
- In 2019, annual insurance premiums for employer sponsored insurance averaged $7,188 for individuals and $20,576 for families. Family premiums have increased 54% over the last decade. On average, workers paid 18% of premiums for individual coverage and 30% for family coverage with the employers picking up the balance.
Non-Group Insurance
The ACA expanded access to the non-group or individually purchased insurance market by offering premium tax credits to help individuals purchase coverage in state-based health insurance Marketplaces. It also included many insurance reforms to alleviate some of the long-standing barriers to coverage in the non-group insurance market. In 2018, about 8% of non-elderly adult women (approximately 8.1 million women) purchased insurance in the non-group market. This includes women who purchased private policies from the ACA Marketplace in their state, as well as women who purchased coverage from private insurers that operate outside of Marketplaces.
- Most individuals who seek insurance policies in their state’s Marketplace qualify for assistance with the costs of coverage. Those individuals with incomes below $49,960 (400% of the Federal Poverty Level) can qualify for assistance in the form of federal tax credits which lower premium costs.
- The ACA set new standards for all individually purchased plans, including plans available through the Marketplace as well as those that existed prior to the ACA. Historically, insurance carriers sold plans on the individual insurance market that often placed women at a disadvantage, either by charging them higher premiums than men for the same level of coverage (gender rating) at many ages or disqualifying women from coverage because they had certain pre-existing medical conditions, including pregnancy. The ACA plans are barred from instituting these policies.
- Many of the pre-ACA individually purchased policies did not include coverage for services that are important to women’s health, such as maternity care, prescription medications, or treatment for mental health conditions such as depression. As a result of the ACA, all direct purchase plans must also cover certain “essential health benefits” (EHBs) that fall under 10 different categories, including maternity and newborn care, mental health, and preventive care.
- Conversely, the Trump administration has effectively eliminated the ACA’s requirement for individuals to have insurance coverage and has promoted health plans that do not comply with the ACA coverage requirements. In particular, the Administration has encouraged greater availability of non-ACA compliant short-term plans, which cost less than ACA compliant policies but can deny coverage to people with pre-existing conditions and often exclude or limit benefits, such as prescription drugs, mental health, and maternity care.
Medicaid
The state-federal program for low-income individuals, Medicaid, covered 17% of non-elderly adult women in 2018. Historically, to qualify for Medicaid, women had to have very low incomes and be in one of Medicaid’s eligibility categories: pregnant, mothers of children 18 and younger, a person with a disability, or over 65. Women who didn’t fall into these categories typically were not eligible regardless of how poor they were. The ACA allowed states to eliminate these categorical requirements and broaden Medicaid eligibility to most individuals with incomes less than 138% of the FPL regardless of their family or disability status, effective January 2014. As of January 2020, 36 states and DC have expanded their Medicaid programs under the ACA.
- Medicaid covers the poorest population of women. Forty percent of low-income women (income below 200% FPL) and 49% of poor women (income below 100% FPL) have Medicaid coverage.
- By federal law, all states must provide Medicaid coverage to pregnant women with incomes up to 133% of the federal poverty level (FPL) through 60 days postpartum; states may not impose cost sharing for pregnancy related services. In states that adopted the ACA’s Medicaid expansion, many women are now able to remain on Medicaid once they become mothers because of the higher eligibility threshold in these states, but in the 14 states that have not adopted Medicaid expansion, many women lose Medicaid coverage 60 days after the birth of their child because their income is above the eligibility level for parents in those states.
- Medicaid financed 42% of births in the U.S. in 2018, accounts for 75% of all publicly-funded family planning services and half (52%) of all long-term care spending, which is critical for many frail elderly women.
- Half of the states (25 states) have established programs that use Medicaid funds to cover the costs of family planning services for low-income women and most states have limited scope Medicaid programs to pay for breast and cervical cancer treatment for certain low-income uninsured women.
Uninsured Women
Women are less likely than men to be uninsured—in 2018, 14% of men 19-64 were uninsured compared to approximately 11% of women ages 19 to 64 (10.8 million women), a decline from 18% in 2008 (Figure 2). Starting in 2010, the ACA required non-grandfathered private group and non-group health that offered dependent coverage to give workers the option of keeping adult children up to the age of 26 enrolled as dependents, while Medicaid expansion offered coverage to many uninsured low-income women who did not previously qualify for Medicaid. As a result, women under the age of 26 and women with incomes below 200% FPL saw significant declines in uninsured rates between 2008 and 2018. Since 2016, the fall in the share of women who are uninsured has stalled. Uninsured women often have inadequate access to care, get a lower standard of care when they are in the health system, and have poorer health outcomes. Compared to women with insurance, uninsured women have lower use of important preventive services such as mammograms, Pap tests, and timely blood pressure checks. They are also less likely to report having a regular doctor.
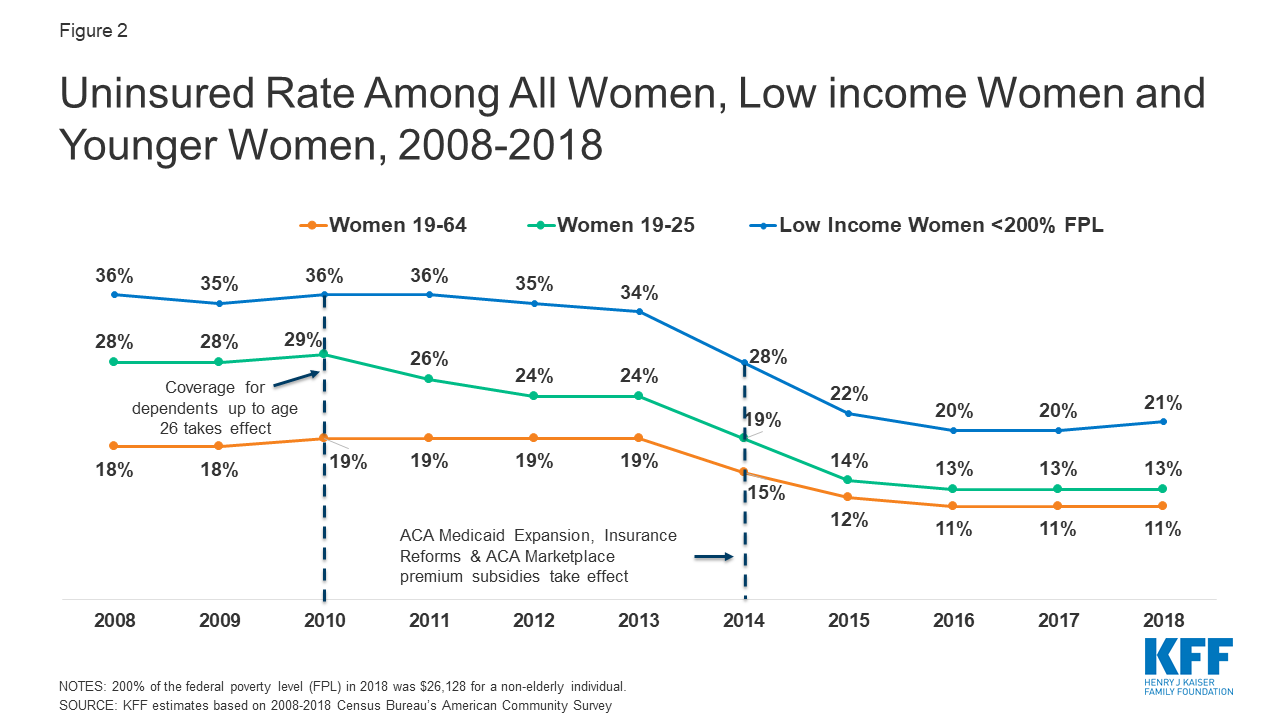
Figure 2: Uninsured Rate Among All Women, Low income Women and Younger Women, 2008-2018
- Low-income women, women of color, and non-citizen women are at greater risk of being uninsured (Figure 3). One in five women with incomes under 200% of the FPL ($26,128 for an individual in 2018) are uninsured, compared to just 7% of women with incomes at or above 200% FPL. A higher share of single mothers are uninsured (13%) than women in two-parent households (9%).

Figure 3: Health Insurance Coverage Among Non-Elderly Women by Selected Characteristics, 2018
- The majority of uninsured women live in a household where someone is working: 67% are in families with at least one adult working full-time and 81% are in families with at least one part-time or full-time worker.
- There is considerable state-level variation in uninsured rates across the nation, ranging from 23% of women in Texas to 3% of women in Washington DC and Massachusetts (Figure 4). Of the 16 states with uninsured rates above the national average (11%), 11 have not adopted the ACA Medicaid expansion.
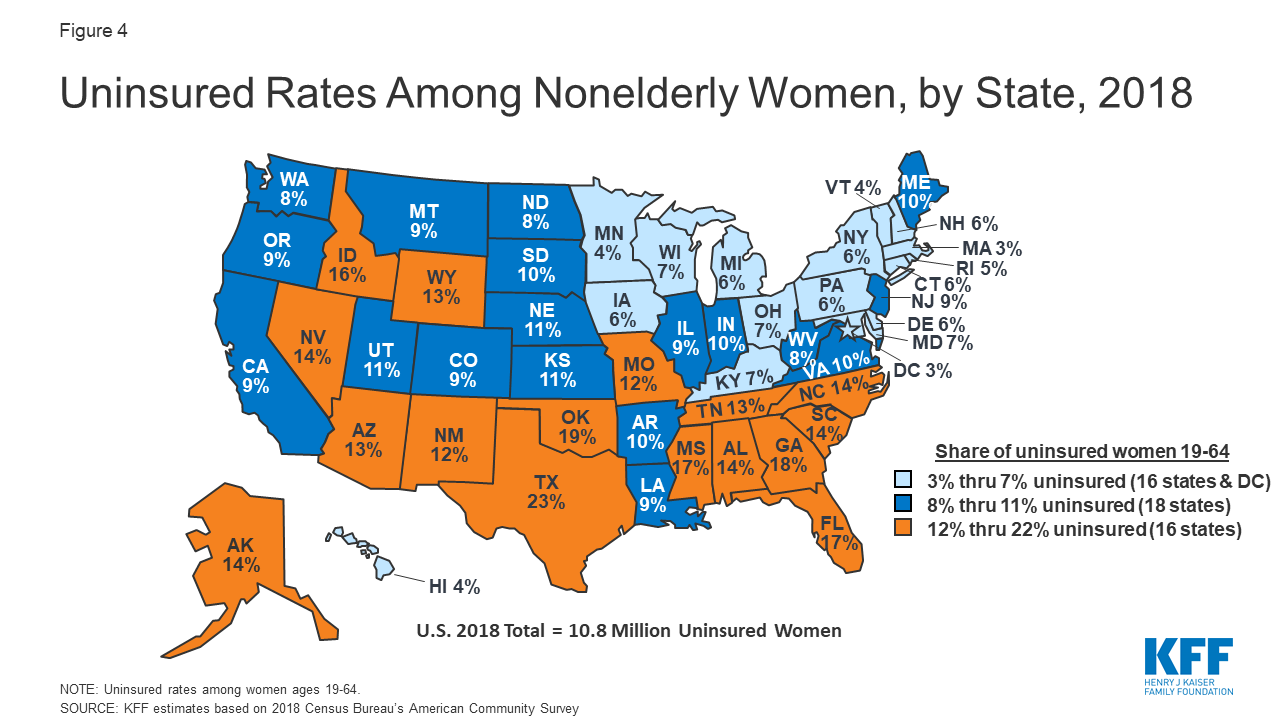
Figure 4: Uninsured Rates Among Nonelderly Women, by State, 2018
Eligibility for Coverage
Many women who are uninsured are potentially eligible for coverage, but are not enrolled. Some, however, still lack any pathway to affordable coverage.
- Over half of uninsured women are eligible for either Medicaid or tax subsidies under the ACA. One in five (2 million) uninsured women are currently eligible for Medicaid but are not enrolled and more than a third (4 million) are eligible for a subsidized Marketplace plan but not enrolled (Figure 5). In 10 states and DC, over 40% of uninsured women are eligible for Medicaid coverage, and in 18 states at least 40% qualify for a subsidized Marketplace plan (Table 2).
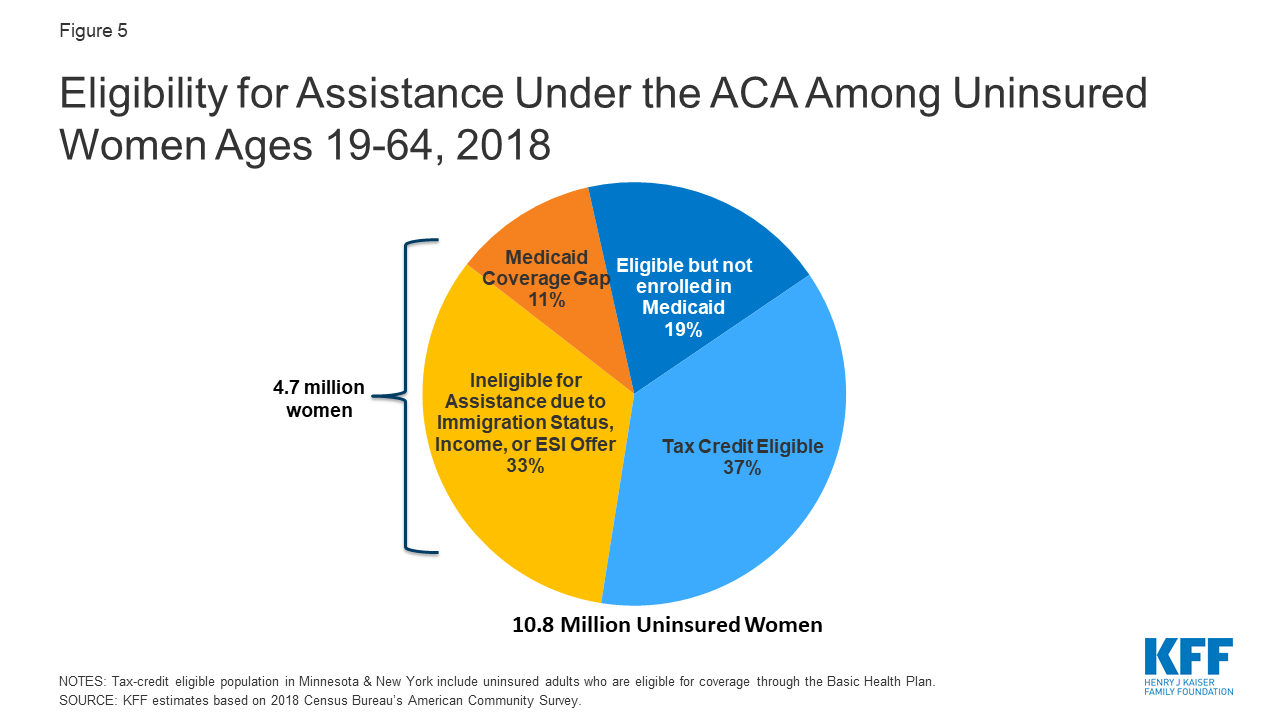
Figure 5: Uninsured Rates Among Nonelderly Women, by State, 2018
- Over 4.7 million uninsured women are not eligible for financial assistance for coverage. Some women who are uninsured are ineligible for coverage because of their immigration status, while other women have incomes that are too high to qualify for federal premium subsidies or have an offer of employer-based insurance but have not enrolled in workplace coverage. Over a million poor women are in the so-called “Medicaid coverage gap.” They live in a state that has not expanded its Medicaid program and do not qualify for Medicaid but have incomes below the lower level for Marketplace subsidies. States that have not expanded Medicaid typically have higher uninsured rates than those that have. In Alabama and Mississippi, about one in three uninsured women are in the Medicaid coverage gap (Table 2).
Scope of Coverage and Affordability
The ACA set national standards for the scope of benefits offered in private plans. In addition to the broad categories of essential health benefits (EHBs) offered by marketplace plans, all privately-purchased plans must cover maternity care which had been historically excluded from most those plans. In addition, most private plans must cover preventive services without co-payments or other cost sharing. This includes screenings for breast and cervical cancers, well woman visits (including prenatal visits), prescribed contraceptives, breastfeeding supplies and supports such as breast pumps, and several STI services. However, the Trump administration’s expansion of short-term plans that do not have to comply with any of these benefits standards could erode the scope of coverage some women receive. Additionally, in 2018, the Trump Administration issued final regulations expanding the type of employers eligible for an exemption from the ACA’s contraceptive coverage requirement to include private employers with a religious or moral objection to contraception. While these regulations are currently blocked by federal courts’ rulings, if these regulations go into effect women who work for exempt employers and female dependents will no longer be entitled to contraceptive coverage. Abortion services are explicitly prohibited from being included as EHBs. Twenty-six states have laws banning coverage of most abortions from the plans available through the state Marketplaces, and plans offered in states that don’t ban coverage must segregate payments for abortion coverage, charging no less than $1.00 for that coverage.
Affordability of coverage and care continues to be a significant concern for many women, both for those who are uninsured as well as those with coverage. The leading reason why uninsured non-elderly adults report that they haven’t obtained coverage is that it is too expensive. Under employer-sponsored insurance, the major source of coverage for women, 55% of all covered workers with a general annual deductible have deductibles of at least $1,000 for single coverage. Thirty-seven percent of women with employer sponsored coverage report that it is difficult to meet their deductibles.
Looking Forward
Health coverage matters for women. Those with health coverage are more likely to obtain needed preventive, primary, and specialty care services, and have better access to new advances in women’s health. Today, women can get coverage without worrying that they will be charged more for insurance than men, be assured that their insurance provides them with no-cost coverage for a wide range of recommended preventive services, and coverage for critical services for women such as maternity care . While there has been much progress in expanding coverage and reducing the number of uninsured women since the passage of the ACA, affordability continues to be a challenge for many women and 10.8 million women still lack coverage. Over half of uninsured women qualify for either Medicaid or subsidies to secure coverage through the Marketplace but many still lack a pathway to affordable coverage.
The significant drop in the share of uninsured women has stalled in recent years. Recent state and federal efforts to roll back ACA-related policies could further weaken coverage and may result in higher out-of-pocket costs for women who need these services. A lawsuit working its way through the courts could result in the entire ACA being invalidated. Meanwhile, a variety of proposals to expand coverage options and lower costs are currently being debated in Congress, on the campaign trail, and by the states. They range from proposals that build on the ACA—expanding Medicaid in states that have not yet done so, enhancing and extending marketplace subsidies to more people, and offering a public plan option alongside private insurance in the marketplaces—to proposals to adopt a single Medicare-for-all program that would replace existing forms of coverage. The outcome of this ongoing debate has substantial implications for women and families who face the health and financial consequences of not having health insurance or who must shoulder significant out-of-pocket cost for their coverage.
| Number of Women (Thousands) | Percent Distribution by Coverage Type | |||||
| Employer Sponsored | Direct Purchase | Medicaid | Other | Uninsured | ||
| United States | 97,429 | 60% | 8% | 17% | 3% | 11% |
| Alabama | 1,460 | 59% | 8% | 14% | 6% | 14% |
| Alaska | 213 | 56% | 5% | 18% | 8% | 14% |
| Arizona | 2,052 | 55% | 7% | 20% | 4% | 13% |
| Arkansas | 874 | 53% | 8% | 24% | 5% | 10% |
| California | 11,959 | 56% | 9% | 24% | 2% | 9% |
| Colorado | 1,711 | 62% | 9% | 16% | 4% | 9% |
| Connecticut | 1,076 | 65% | 8% | 19% | 2% | 6% |
| Delaware | 289 | 63% | 6% | 21% | 4% | 6% |
| DC | 240 | 61% | 9% | 25% | 1% | 3% |
| Florida | 6,242 | 53% | 14% | 12% | 4% | 17% |
| Georgia | 3,218 | 59% | 8% | 11% | 5% | 18% |
| Hawaii | 399 | 68% | 7% | 15% | 7% | 4% |
| Idaho | 490 | 59% | 12% | 9% | 4% | 16% |
| Illinois | 3,829 | 64% | 8% | 17% | 2% | 9% |
| Indiana | 1,957 | 65% | 6% | 15% | 3% | 10% |
| Iowa | 892 | 67% | 7% | 18% | 2% | 6% |
| Kansas | 828 | 67% | 8% | 10% | 4% | 11% |
| Kentucky | 1,320 | 57% | 6% | 26% | 5% | 7% |
| Louisiana | 1,396 | 53% | 7% | 27% | 4% | 9% |
| Maine | 399 | 61% | 10% | 16% | 4% | 10% |
| Maryland | 1,860 | 66% | 7% | 16% | 4% | 7% |
| Massachusetts | 2,114 | 65% | 7% | 23% | 2% | 3% |
| Michigan | 2,971 | 62% | 7% | 22% | 3% | 6% |
| Minnesota | 1,636 | 69% | 7% | 17% | 2% | 4% |
| Mississippi | 883 | 55% | 7% | 16% | 5% | 17% |
| Missouri | 1,803 | 64% | 8% | 11% | 4% | 12% |
| Montana | 301 | 57% | 11% | 18% | 4% | 9% |
| Nebraska | 546 | 67% | 9% | 9% | 4% | 11% |
| Nevada | 904 | 58% | 7% | 17% | 4% | 14% |
| New Hampshire | 403 | 70% | 7% | 13% | 4% | 6% |
| New Jersey | 2,700 | 68% | 7% | 14% | 2% | 9% |
| New Mexico | 603 | 47% | 7% | 31% | 4% | 12% |
| New York | 6,011 | 60% | 7% | 24% | 2% | 6% |
| North Carolina | 3,130 | 59% | 9% | 12% | 6% | 14% |
| North Dakota | 215 | 67% | 10% | 10% | 5% | 8% |
| Ohio | 3,435 | 63% | 6% | 20% | 3% | 7% |
| Oklahoma | 1,133 | 57% | 8% | 11% | 5% | 19% |
| Oregon | 1,250 | 59% | 9% | 20% | 3% | 9% |
| Pennsylvania | 3,768 | 65% | 8% | 18% | 3% | 6% |
| Rhode Island | 320 | 64% | 7% | 22% | 3% | 5% |
| South Carolina | 1,519 | 57% | 9% | 15% | 5% | 14% |
| South Dakota | 245 | 66% | 11% | 9% | 4% | 10% |
| Tennessee | 2,042 | 57% | 8% | 17% | 5% | 13% |
| Texas | 8,526 | 57% | 8% | 9% | 3% | 23% |
| Utah | 891 | 67% | 11% | 8% | 3% | 11% |
| Vermont | 185 | 64% | 8% | 21% | 3% | 4% |
| Virginia | 2,556 | 65% | 8% | 9% | 7% | 10% |
| Washington | 2,256 | 63% | 7% | 18% | 4% | 8% |
| West Virginia | 517 | 56% | 5% | 27% | 5% | 8% |
| Wisconsin | 1,701 | 68% | 8% | 14% | 2% | 7% |
| Wyoming | 163 | 64% | 11% | 8% | 4% | 13% |
| NOTES: “Other” category includes those covered under the military or Veterans Administration as well as nonelderly Medicare enrollees. Percentages may not sum to 100% due to rounding. SOURCE: KFF estimates based on 2018 Census Bureau’s American Community Survey. |
||||||
| Total Uninsured | Tax Credit Eligible | Medicaid-Eligible | Medicaid Coverage Gap | Not Eligible for Assistance due to Income, Immigration Status or Offer of ESI | |
| United States | 10,760,000 | 37% | 19% | 11% | 33% |
| Alabama | 202,000 | 43% | 6% | 30% | 21% |
| Alaska | 29,000 | 34% | 45% | — | 21% |
| Arizona | 274,000 | 28% | 35% | — | 37% |
| Arkansas | 88,000 | 26% | 44% | — | 29% |
| California | 1,023,000 | 25% | 32% | — | 43% |
| Colorado | 147,000 | 33% | 25% | — | 41% |
| Connecticut | 66,000 | 25% | 25% | — | 49% |
| Delaware | 18,000 | 27% | 28% | — | 45% |
| DC | 8,000 | N/A | 47% | — | 38% |
| Florida | 1,085,000 | 47% | 3% | 17% | 33% |
| Georgia | 569,000 | 43% | 5% | 23% | 29% |
| Hawaii | 15,000 | 30% | 26% | — | 45% |
| Idaho | 77,000 | 32% | 41% | — | 27% |
| Illinois | 343,000 | 27% | 34% | — | 39% |
| Indiana | 198,000 | 32% | 41% | — | 27% |
| Iowa | 51,000 | 37% | 35% | — | 27% |
| Kansas | 95,000 | 45% | 5% | 20% | 30% |
| Kentucky | 89,000 | 38% | 34% | — | 28% |
| Louisiana | 131,000 | 30% | 41% | — | 29% |
| Maine | 40,000 | 31% | 43% | — | 26% |
| Maryland | 131,000 | 28% | 26% | — | 47% |
| Massachusetts | 64,000 | 26% | 27% | — | 46% |
| Michigan | 186,000 | 34% | 38% | — | 28% |
| Minnesota | 72,000 | 27%^ | 35% | — | 37% |
| Mississippi | 146,000 | 43% | 7% | 34% | 15% |
| Missouri | 219,000 | 49% | 4% | 24% | 23% |
| Montana | 28,000 | 35% | 43% | — | 22% |
| Nebraska | 61,000 | 24% | 47% | — | 29% |
| Nevada | 127,000 | 24% | 30% | — | 46% |
| New Hampshire | 25,000 | 42% | 25% | — | 33% |
| New Jersey | 244,000 | 30% | 26% | — | 44% |
| New Mexico | 70,000 | 32% | 39% | — | 29% |
| New York | 363,000 | 28%^ | 34% | — | 38% |
| North Carolina | 442,000 | 43% | 4% | 22% | 31% |
| North Dakota | 17,000 | 42% | 32% | — | 26% |
| Ohio | 256,000 | 35% | 39% | — | 27% |
| Oklahoma | 210,000 | 44% | 7% | 21% | 29% |
| Oregon | 112,000 | 33% | 33% | — | 34% |
| Pennsylvania | 237,000 | 33% | 36% | — | 31% |
| Rhode Island | 15,000 | 35% | 17% | — | 48% |
| South Carolina | 209,000 | 49% | 6% | 22% | 24% |
| South Dakota | 25,000 | 54% | 8% | 24% | 14% |
| Tennessee | 261,000 | 46% | 8% | 21% | 25% |
| Texas | 1,956,000 | 43% | 4% | 21% | 33% |
| Utah | 96,000 | 26% | 33% | — | 41% |
| Vermont | 8,000 | 53% | N/A | — | 28% |
| Virginia | 268,000 | 27% | 43% | — | 30% |
| Washington | 180,000 | 27% | 25% | — | 49% |
| West Virginia | 42,000 | 40% | 41% | — | 20% |
| Wisconsin | 119,000 | 41% | 26% | † | 34% |
| Wyoming | 21,000 | 42% | N/A | 20% | 30% |
| NOTES: ^ Tax credit-eligible population in Minnesota and New York include uninsured adults who are eligible for coverage through the Basic Health Plan. † Wisconsin covers adults up to 100% FPL in Medicaid under a waiver but did not adopt the ACA expansion. Some estimates are “N/A” because point estimates do not meet minimum standards for statistical reliability. “—“ indicates state does not have a Medicaid coverage gap. Idaho, Maine, Nebraska, and Utah have approved Medicaid expansion and implementation in these states is expected in the future. SOURCE: KFF estimates based on 2018 Census Bureau’s American Community Survey. |
|||||